
KPIs for eCommerce: What Are the Most Critical Analytics to Look at?
A task as simple as following benchmarks can reap major rewards, considering you’re twice as likely to hit a business goal you track. However, only about 10% of small to medium-sized businesses with growth targets monitor KPIs for eCommerce in real-time.
Whether you want to reach an objective next week or in five years, tracking your progress greatly influences the success or failure of your accomplishments. To help you build a robust monitoring system, we’ll share the essential key performance indicators (KPIs) to keep an eye on for your eCommerce business’s success.
Fulfillment shouldn’t be unprofitable. Learn how MyFBAPrep can help you achieve the ROI you deserve.
Why tracking KPIs for eCommerce is essential for growth-focused brands
Selling online constantly inundates you with data, so you have to decide what’s important and why tracking it will benefit your business. This is where KPIs are key — they gauge company performance by monitoring goal progression and the effectiveness of optimization strategies. Additionally, these metrics help you:
- Get and stay on track:
Gain clarity on whether the actions you’re taking are edging you closer to your goals. - Spot rising issues:
If there’s a problem in your business or potential troubles on the horizon, tracking metrics will enable you to pinpoint and course correct early, in turn minimizing losses and disruptions. - Improve store profitability and efficiency:
Measuring KPIs for eCommerce helps you refine your business operations for optimal efficiency, which drives higher profits.
While you likely already track certain aspects of your business, it’s important to make sure you use relevant KPIs and know when to check them.
Essential KPIs for eCommerce to track and monitor for DTC sales
Now that we know why it’s critical to track KPIs for eCommerce, let’s jump into the top eCommerce metrics to keep tabs on and how often.
KPI and metrics to track annually
Product category performance
As its name implies, product category performance analyzes how well an item category does over a period of time. You can compare past performance or different product categories across all your channels for a comprehensive overview.
Monitoring product category performance drives business growth by revealing which product categories are the best investments and which ones to cut. If you see consistently low performance in certain categories, dropping them may be a good option.
This metric also helps you understand individual product performance. A product may underperform compared to your full inventory but nevertheless could be at the top of its category. If you have to keep that category (for instance, it’s made up of spare parts for your best-selling product), you’ll want to rank item popularity based on its category.
How to check your product category performance
- Create reports from your store analytics for each product category you sell in.
- Look to your competitors or online marketplaces to find product category statistics to use as benchmarks.
- Compare the results.
High gross margin items
The high gross margins metric identifies top-performing products in terms of margins. What counts as a “high margin” will depend on your product type, niche, and business circumstances.
This metric can guide your sales and marketing strategies, such as which products will see high returns with an investment in paid search and influencer marketing. For instance, if you want to boost sales for your Amazon store, it makes more sense to spend $2 per click on a product with a $5 profit margin than on one with a $1.80 profit margin.
Additionally, you can learn which customer segments or audiences to prioritize by assessing who bought your high-margin products.
How to find your high gross margin items
- Run through your product portfolio and organize it by profits.
- Highlight the items with the highest margins.
You’ll need to incorporate actual costs — including cost per sale/cost of customer acquisition, warehousing, fulfillment, average returns, etc. — into your product portfolio for this metric to work.

Metrics and KPIs for eCommerce to monitor quarterly
Customer lifetime value (CLV)
CLV calculates a buyer’s average net profit with your business throughout their time as your customer. For example, a buyer could be worth $4,000 over the seven years they shop with a brand.
CLV provides insight into whether you’re retaining customers and, if so, how successfully. You can then take action either to improve buyer retention or attract new consumers. For example, if you have a low CLV over five years but a high initial profit margin, you’d want to invest more in acquiring new customers. Meanwhile, a low initial profit margin but a high CLV over five years means you should allocate more budget for retention.
You can also use this KPI to gauge how much profit you should anticipate over a certain period to help you plan business investments.
How to check your CLV
The formula for CLV is: Average Transactions Each Month x Average Order Value x Average Gross Margin x Average Customer Lifespan in Months / Number of Buyers in a Specific Time Period
Gross profit margin
Gross profit margin assesses a business’s financial health. It highlights how much cash you have left once you’ve paid off the fixed and variable costs from inventory manufacturing.
This KPI is a simple way to monitor your store’s financial health by showing whether its revenue exceeds its costs. You also gain insight into stock-related issues so you can course correct before problems balloon. For example, if you have a history of shaky gross profit margin results, it could indicate poor market fit or insufficient inventory management.
Combine it with product category and unit performance tracking as well to see which categories and products influence this metric so you can make tweaks and cut costs where needed.
How to calculate gross profit margin:
The formula for gross profit margin is: (Revenue – COGS) / Revenue x 100
Is your fulfillment experience forgettable? Discover how MyFBAPrep can bring your brand into the spotlight.
Metrics and KPIs for eCommerce to measure monthly
Cart abandonment rate (CAR)
Your store’s CAR reveals the percentage of shoppers who add items to their cart on your website but fail to complete their purchase.
High CAR can indicate issues with your shopping experience, such as a lack of product information or on-hand assistance. Analyzing and reducing barriers to purchase can help you reduce your CAR.
Besides lost sales, abandoned carts also represent potential growth. Tracking CAR and taking corrective actions can thus help you turn that negative into a positive. Many selling platforms, including Amazon, allow you to retarget abandoned shopping cart users. You can send abandoned shopping cart emails as well to regain some of those customers.
How to check your CAR
CAR’s formula is as follows: (Number of Completed Transactions / Number of Incomplete Orders) x 100
It’s a little different if you operate on Amazon, though: In Seller Central, go to Brand Analytics –> Search Query Performance –> Brand View –> Select Time Frame. You’ll then see how many shopping cart additions your brand has over your chosen period and can compare that number to total sales.
Conversion rate
This rate is the percentage of how many visitors take an action that qualifies as a conversion. That can be a purchase in your eCommerce store, a lead generated from a marketing campaign, or something similar.
Low conversion rates could point to friction in your store’s buying experience. Improving this KPI will directly improve your store’s revenue.
How to calculate your conversion rate
To find your conversion rate: (Number of Conversions / Total Number of Visitors) x 100
Metrics and KPIs for eCommerce to track biweekly
Average order value (AOV)
AOV is the median amount of money a shopper spends at a store per transaction. To gain a well-rounded view of your eCommerce store’s results, it’s critical to look at this metric in tandem with your conversion rate and lifetime revenue per visitor.
It helps you understand if your pricing strategies align with your store’s revenue goals and are driving growth (and, if not, where you can improve). Strategies to improve this benchmark, such as offering discounts on bundles, sharing complementary products, or having a free shipping threshold over $X, will strengthen your margins. An optimized AOV can then trigger a positive domino effect for your store’s takings and gross profits.
How to check your AOV
The formula for AOV is simple: Revenue / Number of Purchases
Customer Acquisition Cost (CAC)/Cost per Acquisition (CPA)
CAC (or CPA, as it’s known when conversion symbolizes an event) reveals how much cash it takes to acquire a new customer for your online store.
Your store’s CAC reveals whether your sales and marketing strategies succeed at gaining new customers. As a result, it helps guide your promotional investments for better results. By revealing your true marketing costs, you can plan budgets more accurately, such as how much you should spend on Amazon Sponsored Product for individual items based on their margins.
If you’re on Amazon, you’ll also want to look at the following metrics in the platform’s advertising portal:
- ACoS (Advertising Cost of Sale): Ad Spend / Ad Sales
- TACoS (Total Cost of Sales): Ad Spend / Total Sales
- RoAS (Return on Ad Spend): Ad Revenue / Ad Spend to Produce Revenue per Dollar Spent
How to calculate CAC
You can determine your CAC by following this equation: (Total Cost of Sales + Total Cost of Marketing) / New Customers Secured
Metrics to track weekly
Revenue
Revenue — also known as income, turnover, or sales — pinpoints how much capital your business brings in over a given period, such as a week, month, or quarter. It’s also a good idea to look at sales per product and channel, as well as velocity compared to the week and month prior.
Monitor your revenue to make sure you have enough capital coming in to cover your obligations. These figures also indicate how viable your marketing and sales initiatives are. Be sure you look at actual cash flow, which is your profit margin after all costs, rather than inbound revenue only.
How to check your revenue
Pull a sales report from your store’s data. It should account for all completed sales on every channel.
Website traffic
This metric tracks how many visitors your store sees over a certain time frame. It’s important to consider the niche and channel average traffic to benchmark and understand your store’s performance.
The more visitors you can bring to your store, the more opportunities you’ll have to convert them into paying customers, so you need to know if your marketing campaigns are driving sufficient traffic.
Over time, you’ll be able to better build metrics on how traffic correlates to sales. For example, if you pay for a high volume of web traffic but see low conversions, you’ll want to change up your advertising strategies to draw in more relevant prospects. On the other hand, if your advertising campaign delivers traffic with a high rate of conversion, increasing your ad spend could work in your favor.
How to monitor website traffic
Use analytics software like Google Analytics, Crazy Egg, or Kissmetrics. For an Amazon store, check the Amazon Business Reports in Seller Central. Keep in mind that Amazon refers to unique pageviews as sessions.
Note: There may be some slight variations in results due to data lags and differences in interpreting information.
Return rate
Return rate is the percentage of orders that customers send back to you. This is important for all channels but especially on Amazon, where too many returns can result in a store suspension. You can single out problem items and eliminate their stock by analyzing this rate. Conversely, you can see which items customers rarely send back and figure out why.
High return rates can indicate specific issues, so you should also track the reasons for return. If you frequently see “damaged in shipment” as a cause, you could improve your product packaging. Or, if customers frequently list the item as “not as expected,” then you’d want to refine your product descriptions and photos to ensure customers clearly understand what they’re buying.
How to calculate your return rate
Calculate return rate as follows: (Number of Returned Items / Total Completed Orders) x 100
Amazon-specific KPIs for eCommerce to track
According to Amazon, independent sellers contribute to over 60% of sales, most of which are small and mid-size businesses. With 7,800 products sold through private sellers every minute on Amazon and 4.1 billion total items sold in 2022 alone, Amazon is the place to be for eCommerce.
While you should be tracking KPIs on Amazon just like your other channels, the marketplace offers extra data to keep an eye on. So, in addition to the KPIs for eCommerce listed above, you’ll want to track a few Amazon-specific metrics, which include:
- Order defect rate
- Reviews and seller feedback
- Inventory performance indicator
- Featured Offer percentage
- Unit session percentage rate
- Account health
Order defect rate
Order defect rate (ODR) is the percentage of orders, typically over a 90-day period, that possess a defect, such as negative feedback, late shipment, or chargebacks. Exceeding 1% ODR can result in a warning or an account suspension on Amazon. In most cases, you’ll want to check this at least monthly.
Reviews and seller feedback
Monitoring your seller feedback and reviews is a critical part of maintaining your Amazon account health. Pay attention to:
- Reviews: These are about the product you sell, how it arrived, and the buyer experience with the product.
- Seller feedback: This covers the buyer’s experience with you as a seller, including your shipping time, communication, etc.
You should also have a strategy in place to build more (positive) reviews, as they directly impact conversion rate, rankings, and your ability to continue selling on Amazon. Just be sure to follow Amazon’s Review Policy to avoid negative repercussions for your store.
You can also leverage tools like Amazon Vine and the Request a review feature to boost social proof for your products and store. Make sure you have a process in place to request a review manually from every seller 5 to 30 days after the delivery date so you maximize the number of reviews you receive. We also recommend searching competitors’ reviews to look for common complaints or issues. Avoid their mistakes and refine your on-page content to surpass buyer expectations.
You’ll want to track metrics like:
- What percentage of product purchases earn reviews
- How requests for reviews impact that metric
- What percentage of reviews are positive
Once you have a process in place to request and monitor reviews, you’ll be able to use that data to improve your customer service, tweak issues with your offering and packaging, and refine your review request strategy.
Inventory Performance Index
Although Amazon keeps the math behind their Inventory Performance Index (IPI) a secret, they do suggest sellers pay special attention to three factors to boost that number:
- In-stock inventory: Avoid stockouts and lost sales
- Excess inventory: Minimize inventory carrying and storage costs
- Stranded inventory: Ensure your products are available for purchase and delivery
If your IPI falls below 350, Amazon will limit your ability to send more inventory as well as impose a penalty on any excess stock sitting in their warehouses. You can review your IPI in the “Manage Inventory” tab.
In general, you want an IPI of 450 or higher to qualify for maximum FBA storage. You’ll also want to maintain a sweet spot of 30 to 60 days of inventory as much as possible. This metric impacts your sales, Amazon account health, and FBA storage, so keep a close eye on it, especially around the 15th of every month.
Featured Offer percentage
A whopping 83% of Amazon sales occur through the Featured Offer (formerly Buy Box), so knowing how to win the Featured Offer for your products is critical to earn more conversions.
Numerous factors affect your chances of winning this coveted spot, including your chosen fulfillment method, total product price, and delivery speed. Check these regularly and make improvements on the most critical variables to increase your Featured Offer win rate and, in turn, your sales. Many sellers also increasingly use automatic repricer tools to attempt to keep it, which can be a great strategy if you know your margins.
You can find Featured Offer metrics on your Seller home page and in Amazon Business reports on the ASIN level or as the average rate of all your listings in a chosen period.
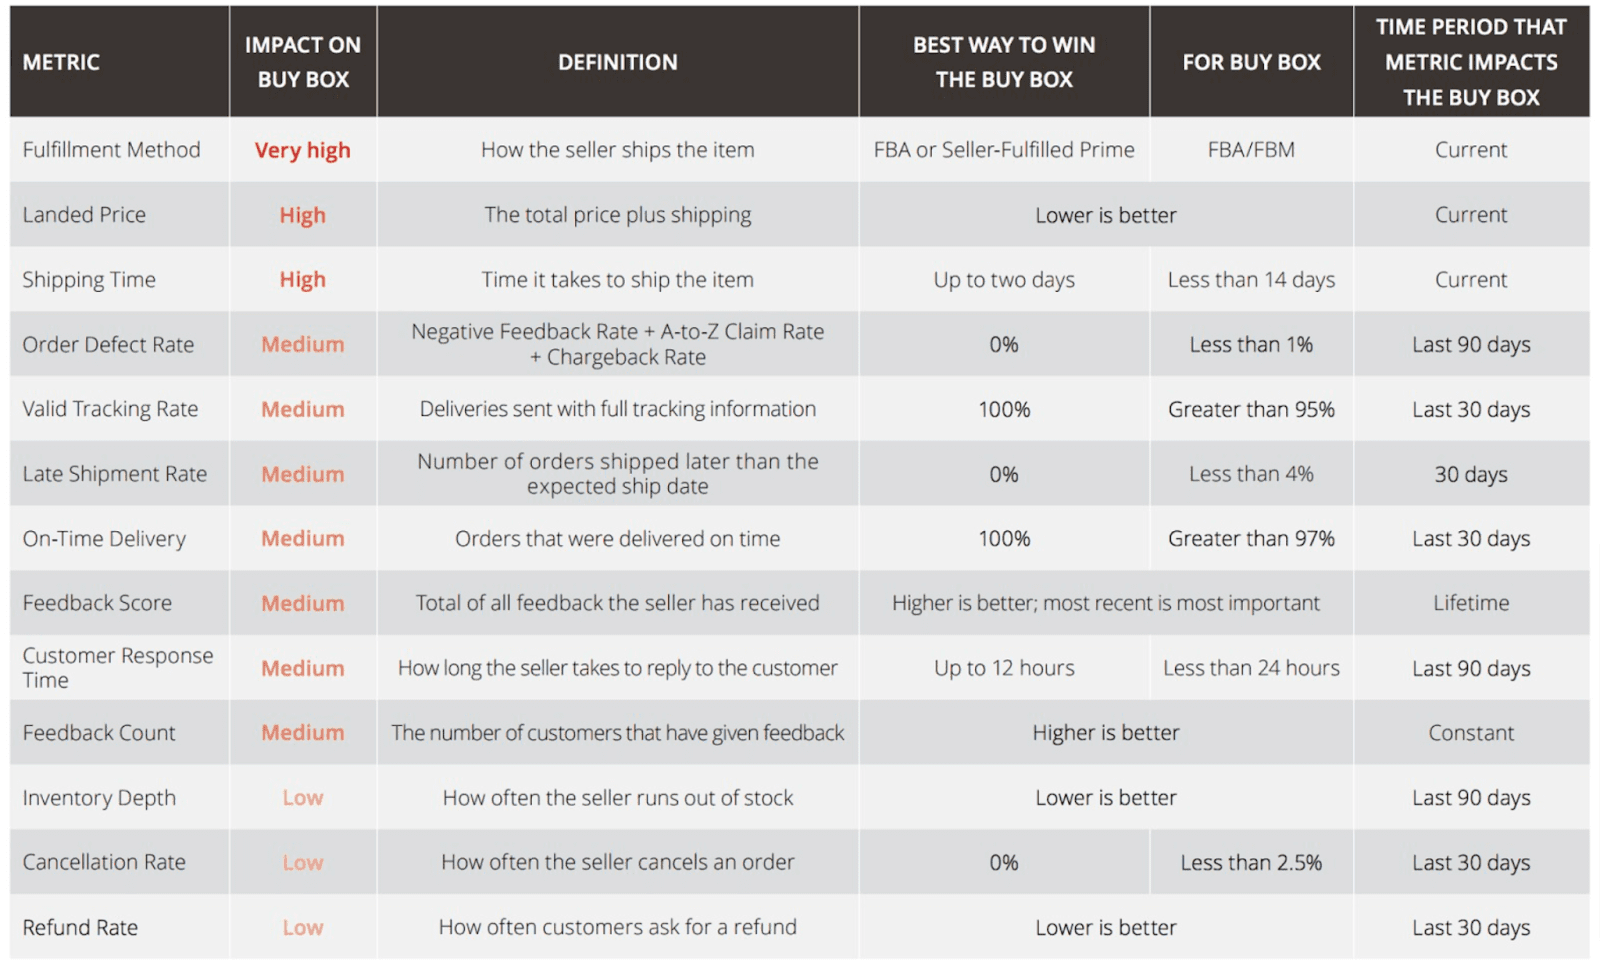
Source: BigCommerce
Unit session percentage rate
The unit session percentage rate is the number of units ordered divided by the total number of sessions. So, the greater the percentage, the more sales you’re making. It’s basically an Amazon-specific metric for conversion rate, and you want it to fall between 10%-15%.
This metric indicates the quality of your both product page and advertising strategy. You can improve your session percentage rate by:
- Including product videos
- Split testing to find the perfect product photos and phrasing
- Improving SEO (paying special attention to keywords in your product title and page copy)
- Upgrading your A+ Content page branding
- Increasing the number of reviews and their ratings
- Revising and optimizing your PPC activities
Account health
Account health is Amazon’s rating of your account performance and standing. Healthy accounts are rated between 200-1,000. You can view this metric at any time by going to the “Performance” tab in Seller Central and clicking Account Health. Looking at it about once a month is a good idea, even if you’re confident you’re in good standing.
Account health brings customer service performance, policy compliance, and shipping performance into a single KPI. If your account health starts to drop, it means you’re not meeting one of those standards, so you should investigate before it harms your store’s standing with Amazon.
Walmart-specific KPIs for eCommerce to track
Amazon may own a large percentage of the eCommerce market in the U.S., but they’re not the only platform available. Walmart is the second-largest in the category, with a 6.4% share of the total eCommerce market.
Like Amazon, Walmart has their own key performance indicators to pay attention to. However, most are very similar to Amazon’s and other DTC standards, like:
- Order defect rate
- On-time shipping rate
- Valid tracking rate
All of this is available in your seller Scorecard, under Account –> Performance.
Order defect rate
The order defect rate comprises the full range of things that can go wrong with an order. If you also sell on Amazon, it’s extremely similar. Walmart tallies together “defects” like cancellations, returns, delivery problems, and customer complaints.
You need to keep this number at 2% or less over a 90-day period. So, if fewer than 2 out of 100 of your orders over 90 days have a defect, you satisfy this requirement.
Order defect rate normally directly reflects quality of listings, pricing, and inventory management, which means it typically represents a healthy and well-functioning eCommerce store. So, for a strong rate, you also need to pay attention to:
- Customer service
- Which shipping option is selected for a product
- Product page quality
If you notice a rise in order defect rate, you’ll have to look at every aspect of your account to figure out what went wrong.
On-time shipment rate
When you upload products to the Amazon marketplace, you add a shipment method and normal shipment times. Walmart sets an expected ship date (ESD) for every order based on that information. This includes calculations based on data you give Walmart, as well as the platform’s own standards.
You’ll see a drop in on-time shipment for shipments that are marked as shipped later, those without a valid tracking number, and late deliveries. On-time shipping rate has to be 99% or higher, and if you can’t meet that number, you could lose seller privileges or receive account warnings and eventually a sanction.
Valid tracking rate
Walmart also requires you to provide a valid tracking number with every order, so it’s generally necessary to leverage a 3PL simply to keep tracking costs lower while maintaining a 99% valid tracking rate or higher.
You’ll also want to pay attention to other scorecard information, like your seller response rate. Here, you have a 48-hour window to respond to customer service requests, and that counter starts from when the message is received. This metric has to be at 95% or higher.
Wrapping up — Lead the pack with KPIs for eCommerce
Your eCommerce store’s dashboard and analytics contain a wealth of opportunity. Keep an eye on relevant KPIs to gain an objective view of your marketing, sales, and product performance. Executing optimizations based on hard facts can power growth, customer satisfaction, and profitability. So, take steps now to track KPIs for eCommerce and make your online business more efficient and fruitful.

Published: Dec 20, 2022
Updated: July 18, 2024